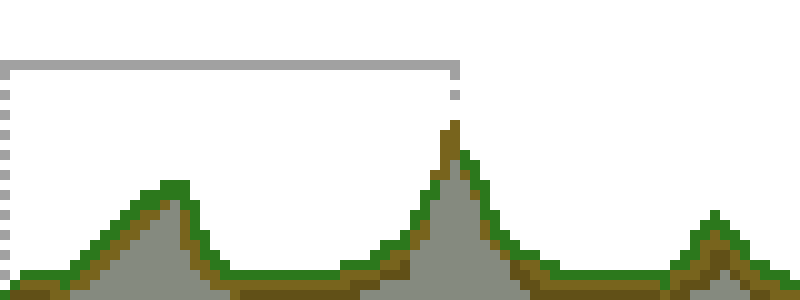
You're standing at the base of a mountain, looking upwards at the summit. Clouds obscure the absolute enormity of the task in front of you; learning data structures and algorithms. But what if the mountain itself was representative of a common data pattern? What if the total distance one must travel to reach any peak was solvable through some common heuristics?
Let's try. First, imagine a two-dimensional plane with valleys and peaks.

What if I wanted to know, from left to right, what the biggest distance was between any valley and any peak?

Visually, this is pretty easy to do. From left to right, you look for the lowest point, followed by a high point. You 'judge' the height, then continue looking. If you ever spot a new lowest point, you mentally assign that as the new 'minimum' and then continue looking for new peaks.
Let's use another example. Pretend this is stock market data, and you are trying to figure out the best time to buy and sell a stock (LC#121):

We can apply the exact same heuristic as before to determine the optimal points to buy and sell a given stock.

Visually, what does this heuristic look like? Let's demonstrate with some numbers.
*---------------------------*
| 5 | 4 | 2 | 6 | 4 | 8 | 3 |
*---------------------------*
Let's assume the above is the price, over time, of some given stock. We want to know when the best time would be to both purchase and sell this stock in order to maximize profit. In order to do this, we start by assuming we 'purchased' the first occurence of the stock.
*---------------------------*
| 5 | 4 | 2 | 6 | 4 | 8 | 3 |    profit = ?
*---------------------------*
 /\
 BUY
But how do we know when to sell? I suppose we could simulate the profit of selling this stock at this price, then repeat this for every element(without considering the impossibility of selling in the past).
*---------------------------*
| 5 | 4 | 2 | 6 | 4 | 8 | 3 |    profit = -1
*---------------------------*
 /\   /\
 BUY SELL
*---------------------------*
| 5 | 4 | 2 | 6 | 4 | 8 | 3 |    profit = -3
*---------------------------*
 /\       /\
 BUY     SELL
*---------------------------*
| 5 | 4 | 2 | 6 | 4 | 8 | 3 |    profit = 1
*---------------------------*
 /\           /\
 BUY         SELL

 e.t.c.
However, this is quite inefficient. A better approach would be to use the heuristic I mentioned at the top, otherwise known as a 'Sliding Window'.
SLIDING WINDOW: Used when you want to view subsets of a larger dataset by creating a window that 'slides' over your data, therefore minimizing redundant computations.
With this heuristic in mind, let's traverse the stock data from above. Instead of calling a point "BUY", or "SELL", I'll exchange that for "LOW" and "SELL" which better illustrates what is happening.
*---------------------------*
| 5 | 4 | 2 | 6 | 4 | 8 | 3 |    profit = 0
*---------------------------*
 /\   /\
 LOW SELL?

Selling price was lower that LOW, so update LOW.

*---------------------------*
| 5 | 4 | 2 | 6 | 4 | 8 | 3 |    profit = 0
*---------------------------*
     /\  /\
     LOW SELL?

Selling price was lower that LOW, so update LOW.

*---------------------------*
| 5 | 4 | 2 | 6 | 4 | 8 | 3 |    profit = 4
*---------------------------*
         /\  /\
         LOW SELL?

SELL - LOW = 4, which is better than our previous best (0).

*---------------------------*
| 5 | 4 | 2 | 6 | 4 | 8 | 3 |    profit = 4
*---------------------------*
         /\      /\
         LOW    SELL?

SELL - LOW = 2, which is not better than our previous best (4).

*---------------------------*
| 5 | 4 | 2 | 6 | 4 | 8 | 3 |    profit = 6
*---------------------------*
         /\          /\
         LOW        SELL?

SELL - LOW = 6, which is better than our previous best (4).

*---------------------------*
| 5 | 4 | 2 | 6 | 4 | 8 | 3 |    profit = 6
*---------------------------*
         /\              /\
         LOW            SELL?

SELL - LOW = 1, which is not better than our previous best (6).
From the above example, we visit each element exactly one time (O(N)) and don't require any extra data structures to store information (O(1)). This makes this a very efficient approach to solving the sliding window problem, which you can view here.
In general, you can view the sliding window algorithm like this:
- We are looking for some subset of data in a larger dataset, and order must be maintained.
- The right side of the window will move at a fixed speed, incrementing over all elements.
- The left side of the window is subject to some condition, by which it will 'slide' inwards to meet a criteria.
Thanks,
-- Colt
Sources
A full breakdown of resources I used in sourcing this material:
